CTCL Staff Hits the Road to Collect Voting Time Data on Election Day
For many people, Election Day means heading to the polls to cast their ballots. But for four of CTCL’s staff members, this past Election Day was spent on the road collecting important data on voting times.
Working toward our goal to create a Voting Time Estimator tool for the Election Toolkit, we visited three metro areas and collected more than 3,300 vote times from 34 polling places. Along the way, we met lots of friendly people and got a feel for what it’s like to vote in the communities we visited.
Denver, Colorado
Executive Director Tiana Epps-Johnson and Donny Bridges, Director of Civic Data, collected data in the Mile High City, Denver. After an easy flight, they used Denver’s new light rail service to get into the city.
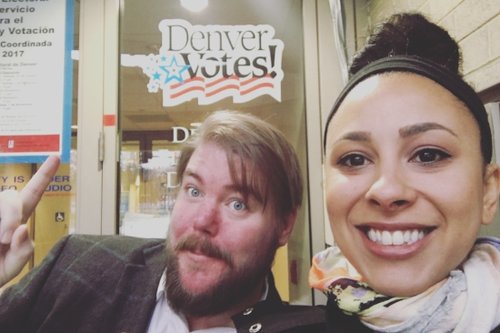
Stationed at the Denver Elections Division office downtown, they were able to watch voters marking ballots while also seeing election workers process ballots and verify signatures.
Denver’s ballots contained 1-2 school board races and 9-10 initiatives. According to Donny, vote times varied based on voter behavior.
“The average vote time hovered around four minutes,” Donny explains, “with some folks coming in completely prepared and getting out within a minute and others taking much longer in contemplating their choices.”
Even though their focus was on voting times, Tiana and Donny were also struck by Denver’s innovative voting system — in particular, all the available voting options. Colorado mails ballots to all voters prior to the election, and voters can return them by mail, vote them in person at vote centers, or deposit them using convenient drop boxes.
“Denver is an amazing example of a process that is designed to be as convenient as possible for as many voters as possible,” Tiana observes. “You can even get a ballot to-go on Election Day as long as you return it to a drop box by the time polls close!”
Donny was especially charmed by a drop box that was set up in the middle of a road downtown for drivers (and cyclists!) to use. “Although, I didn’t envy the poor poll workers who had to stand out there in the sub-freezing weather!” he says.
All told, Tiana, Donny, and a few Elections Division staff members collected over 270 voting times — all while managing to avoid frostbite.
St. Louis County, Missouri
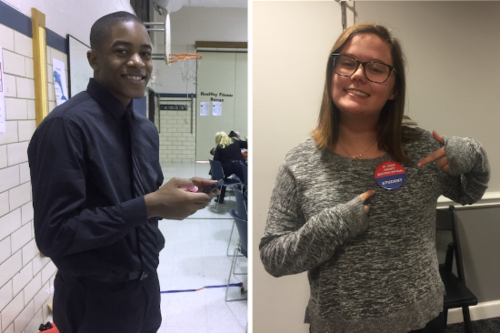
Road tripping in a rental car, Director of Government Services Whitney May traveled to St. Louis County, Missouri, where she visited 20 (!) polling places. Data collection here was performed by a team of 20 high school students who were organized and trained by Board of Elections staff.
Driving around St. Louis County, Whitney met with each student, answered their questions about the project and about using the Voting Timer App, and reminded them about data collection protocols.
She was impressed with their dedication and thoughtfulness.
“Every high school student who collected data in St. Louis County was absolutely fantastic,” Whitney emphasizes. “They were professional, curious, and focused on their task. All of the students recognized the value of being a poll worker, whether it was for compensation, community service hours, or college application materials.”
Ballots in St. Louis County were focused on referenda, including either one or two initiatives per ballot. Whitney noted that the average voting time was about 30 seconds, while turnout was a bit over 10%.
In between visiting polling places, Whitney participated in a Facebook Live video broadcast alongside Democratic Director of Elections Eric Fey and Charles Stewart III of MIT to talk about the Voting Time Estimator project.
Something that Whitney observed about St. Louis County is an emphasis on carrying out election procedures in a bipartisan way.
“Polling places are staffed with members of both major political parties,” Whitney reports, “and election results are returned to the election office by a 2-member team: 1 person from each party. Both major political parties are also explicitly represented in full-time staff at the election office.”
Ultimately, St. Louis County’s army of high school data collectors gathered an incredible 2,800 vote times, playing a huge role in helping us reach our data goals.
Providence County, Rhode Island
Meanwhile, on the East Coast, Government Services Associate Kurt Sampsel visited three suburban towns in Providence County, Rhode Island to time voters. Enjoying the pretty autumn sights of New England, Kurt started in East Providence, then drove to Lincoln, and then to Scituate, visiting a total of six polling places.
At each polling place, Kurt introduced himself to poll workers, explained his reason for the visit, and set up at a discreet spot where he could observe voters. Poll workers kindly offered him coffee, cookies, and homemade treats that helped him keep his energy up during the 13-hour day.
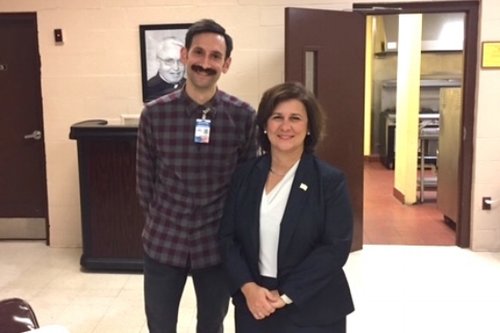
In addition to friendly poll workers, Kurt enjoyed the opportunity to meet Rhode Island Secretary of State Nellie Gorbea at a polling place in East Providence.
“Secretary Gorbea has done a lot to encourage civic pride and make voting easier in the state,” Kurt explains, “and she was quite supportive of my data collection work and curious about what it would reveal.”
The East Providence ballot was the largest one that Kurt timed, with six referenda, while the Lincoln and Scituate ballots each had just a single school bond measure. Even with these single-item ballots, Kurt saw strong engagement in both towns.
He also witnessed the impact of new voting equipment — especially the electronic poll books — on the voting experience.
“Every single poll worker I spoke to, whether young or old, loves the new e-poll books,” Kurt says, “and voters liked the surprise of not having to sort themselves by last name when approaching the check-in table, like with the paper poll books. In the entire day, I’m not sure I saw a single hiccup at any of the check-in stations.”
At the end of the day, Kurt had timed 292 voters, with average times of about 2.3 minutes in East Providence and 29 seconds in Lincoln and Scituate.
Nationwide
While we were out collecting voting time data, volunteers around the country were doing the same in their own jurisdictions. In addition to the locations we visited, we received Election Day data from dedicated volunteers in the following places:
- Inyo County, California
- Cleveland County, North Carolina
- Hunterdon County, New Jersey
- Alexandria, Virginia
- Arlington, Virginia
Together, this data will help us move forward with our goal of collecting 25,000 vote times for at least 500 unique ballots.
Thanks to all the election officials who participated in this research project to help improve the voting process. Your data collection efforts are powering a free tool that will be available to benefit all election officials in 2018.
Would you like to host us for data collection in 2018? Or, would you like to collect data yourself? We’d love to talk with you. Email Kurt at [email protected] to start the conversation.