Rhode Island Simulates Election Day to Reduce Wait Times
This story was featured in our ELECTricity newsletter in February 2020. Sign up to receive more success stories from election offices across the country. And how is your election office using technology to run excellent elections? Tell us about it by emailing [email protected] — we’d love to share your story!
The kind of record turnout we’re expecting in the 2020 elections is fantastic—what election administrator doesn’t dream of a more civically engaged community?—but it’s also stressful. You might need more scanners, more poll workers, more voting booths. But how many more? And which precincts need extra resources most? Will an influx of first-time voters slow down the line? Will an ePollbook malfunction contribute to the Elbow of Death, the phenomenon where a line becomes near-permanent and ever-growing?
You know your jurisdiction better than anyone, and usually you can allocate resources using common sense and top-level turnout data from previous years. But 2020 might be more complicated. Significantly more voters are “extremely enthusiastic” about voting—hundreds of days before the 2020 election—than in the final days of previous presidential elections. Even more than usual, the 2020 elections require complex data-driven decisions that optimize resource allocation.
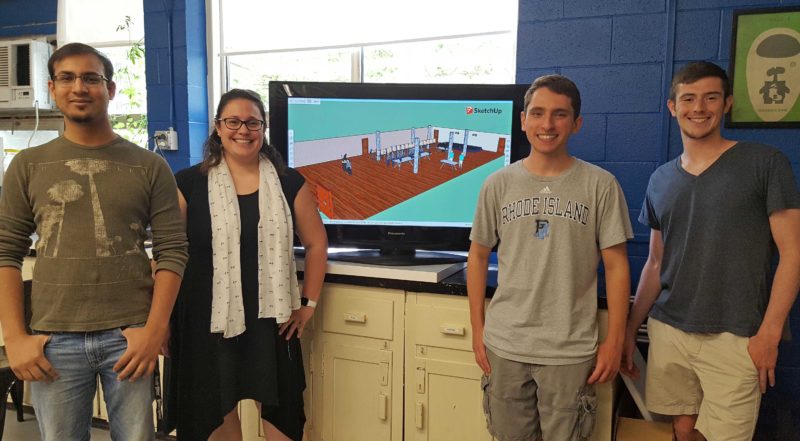
Are you ready? Rhode Island certainly is. For the past several years, Rhode Island has been partnering with a team of researchers at the University of Rhode Island (URI) to simulate Election Day scenarios. These high-tech simulations mimic voter behavior during the voting process, from arriving at the polls and standing in line to check in, to voting their ballot, to casting their ballot at a scanner. The simulations can predict voter wait times based on different Election Day scenarios—including record turnout—and make recommendations like, “if you add an extra resource to this precinct, you’ll reduce voter wait time by X minutes.”
Rhode Island used these technological insights to make resource allocation decisions and “get record turnout through the second-most densely populated state in the 2018 Midterms with no issues whatsoever,” says Gretchen Macht, Ph.D., the Assistant Professor leading the URI team, affectionately called URI VOTES.
Best of all, the URI VOTES team received additional grant money to help jurisdictions outside of Rhode Island—jurisdictions like yours. They already have the technology, the queuing theory expertise, and the experience working with election administrators. “We have seen what it is like for election administrators,” says Professor Macht, “and we are here to help you.”
Reducing Voting Delays in Rhode Island
In 2016, Rhode Island struggled with long lines and voting delays. The problem wasn’t evenly distributed—overall, elections ran smoothly, but five localities in particular struggled and some voters waited over two hours to vote. Rhode Island’s Secretary of State, Nellie Gorbea, convened a task force to study the cause of delays.
Elections are complex, so there was no single cause. Nearly 600 new voting machines were rolled out in 2016 with extra security and encryption features, which doubled the scanning time. The difference between 2 and 4 seconds might seem insignificant but every second counts on Election Day. Voters had more time to handle their ballots, sometimes even folding them, often causing paper jams. Voters with longer ballots tried forcing multiple pages into the scanner at once, again causing paper jams. In previous years, voters would step aside at an error, but the new system required voters to remain at the scanner until their problem was fixed, which caused even longer lines. A few locations piloted electronic poll books, which sped up check-in times, but faster check-in times don’t necessarily reduce wait times if the line re-forms at the next bottleneck.
The task force turned to Professor Macht, an expert on queuing theory, the science of waiting in lines. She presented research on queuing theory in general, including real-world applications “such as E-ZPass for high-speed tolling, or a fast pass at an amusement park.” Then she spoke about election-specific queuing theory and how the URI School of Engineering could help.
The task force’s final report concluded that “the Board of Elections and local election officials should continue to work with Professor Macht… to identify best practices in queuing theory, identify contingencies, and implement better polling place design.” After that, Professor Macht received a $226,942 grant funded by the Secretary of State’s office, the College of Engineering, the Board of Elections, and Democracy Fund.
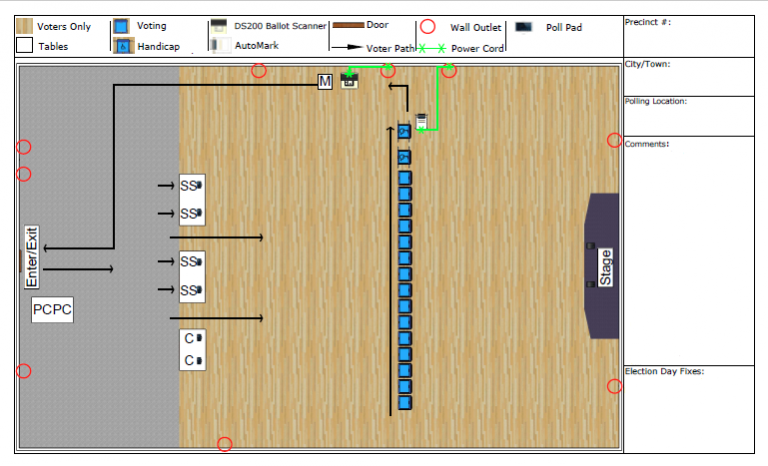
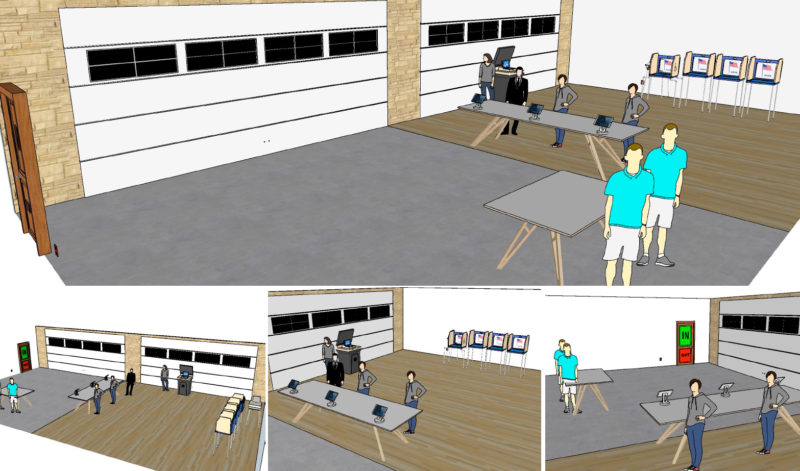
Professor Macht and her new URI VOTES team got to work, collaborating closely with the Board of Elections. They built simulations from past data, comparing successful polling places to unsuccessful ones. They fine-tuned the models based on variables like ballot length, polling place layout, times of day, and the use of electronic check-in. They sent URI students to visit physical voting locations and assess the layout, electricity, parking, and accessibility of each, using that information to build models of the different precincts. They created both 2D and 3D simulations—even using virtual reality (VR) headsets to help election officials visualize the flow of voters through different polling places.
Professor Macht’s research resulted in several recommendations for streamlining the 2018 elections, including increasing/decreasing the amount of voting equipment at specific precincts and using electronic poll books at check-in stations. Legislation was passed in 2017 to give the Board of Elections the authority to send more than one voting machine to a polling place, allowing greater flexibility in resource allocation. Rhode Island also worked with Professor Macht to better coordinate the roving technicians that spend Election Day fixing issues—and they improved poll worker training so that poll workers could fix simple issues themselves.
The partnership was hugely successful in 2018—Rhode Island handled record turnout without any of the problems seen in 2016. Rhode Island has continued working with Professor Macht and her team for 2020 preparation. Already, URI VOTES has contributed 170 hours of human time with over 2.2 million simulation runs of Election Day 2020. According to Stephen Erickson from the Board of Elections, “this is providing a level of technological insight that we have never had access to.”
Simulating Elections Across the Country
After the success of the initial two-year grant, URI VOTES received a second Democracy Fund grant of $198,000 to expand the project to a national scale.
There’s no one-size-fits-all solution—every state, jurisdiction, and polling place is unique. That’s why highly-specific, customized simulations are so useful. “When a new jurisdiction reaches out,” Professor Macht says, “the URI VOTES team, first, wants to get to know them, hearing about their experiences, and understanding what they are looking for.” The team becomes familiar with the jurisdiction’s voting system and processes, such as the equipment used, whether the jurisdiction uses a vote center or precinct model, and the prevalence of early voting and mail voting. “Any part of this can be in-person or over a video conference call,” Professor Macht says. “However, the more complex your system, the higher the likelihood that we are going to want to observe your next election.”
Once the simulation models are created, they can be used to test different options. These recommendations generally sound something like:
— Adding an additional resource to this location will reduce the expected time to vote to X minutes/seconds
— If turnout reaches XX%, this location will need Y amount of equipment to meet the minimum allowable time to vote
“Every election is unique, making it difficult to plan for the next one,” Professor Macht says. But the simulations let election officials experiment with different scenarios, including different turnout rates, so extreme cases can be planned for accordingly. “We know that variation occurs,” she says, “and that humans are relatively unpredictable, so we do the best we can to capture the randomness in the process and use it to our advantage.”
After models are created and simulations are run, election administrators give feedback and the models are tweaked and re-run. “Feedback is everything,” she says, especially because election administrators “know their locations better than our team, so their experiences assist our recommendations.”
Jurisdictions that partner with URI VOTES also have the option of using visual simulations. “We use VR headsets to demonstrate how a polling location will behave in a simulation,” Professor Macht says. “These visual models give election administrators an idea of what a setup polling location will look like and how it will function on Election Days.”
Streamlining Your Jurisdiction’s Voter Experience
First and foremost, get in touch with the URI VOTES team. They’re brilliant, enthusiastic researchers who cannot wait to partner with more jurisdictions. “This is an opportunity,” Professor Macht says, for both herself and her students, “to not only participate in democracy but to exercise our engineering tools for the betterment of democracy.”
You can also take advantage of the free tools on ElectionTools.org. The Voting Time Estimator predicts how long it will take to vote a ballot based on the number and type of questions on the ballot. The Voting Timer App lets you measure the average voting time of real voters. The Polling Place Resource Planner lets you run basic simulations to calculate wait times. The simulations aren’t as advanced as the URI VOTES team’s simulations, but they’re a fast, easy way to make basic predictions.
A good records-retention policy can help with future elections. According to Charles Stewart III’s report, Managing Polling Place Resources, many election offices discard their valuable data shortly after the election ends—data such as how many check-in stations or voting machines were assigned to each precinct. “Without an archive of past allocation decisions and statistics such as precinct-level turnout,” the report warns, “a local election jurisdiction will be unable to learn from the past as it makes allocation decisions for the future.”
Additionally, if you’re buying new voting equipment, such as poll books, ballot marking devices, and scanners, the report also recommends using your RFP (Request for Proposals) process to require “that the equipment provide event logs in ways that are easily retrievable and easily portable into commonly used software tools such as Excel.”
No matter how basic or advanced your office’s current resource allocation decisions are, the URI VOTES team can help take you further. Contact Professor Macht and the URI VOTES team at [email protected].
How have you used data to make decisions around resource allocation and polling place setup? We would love to hear from you! Tell us about your experience by emailing [email protected].